Latest News
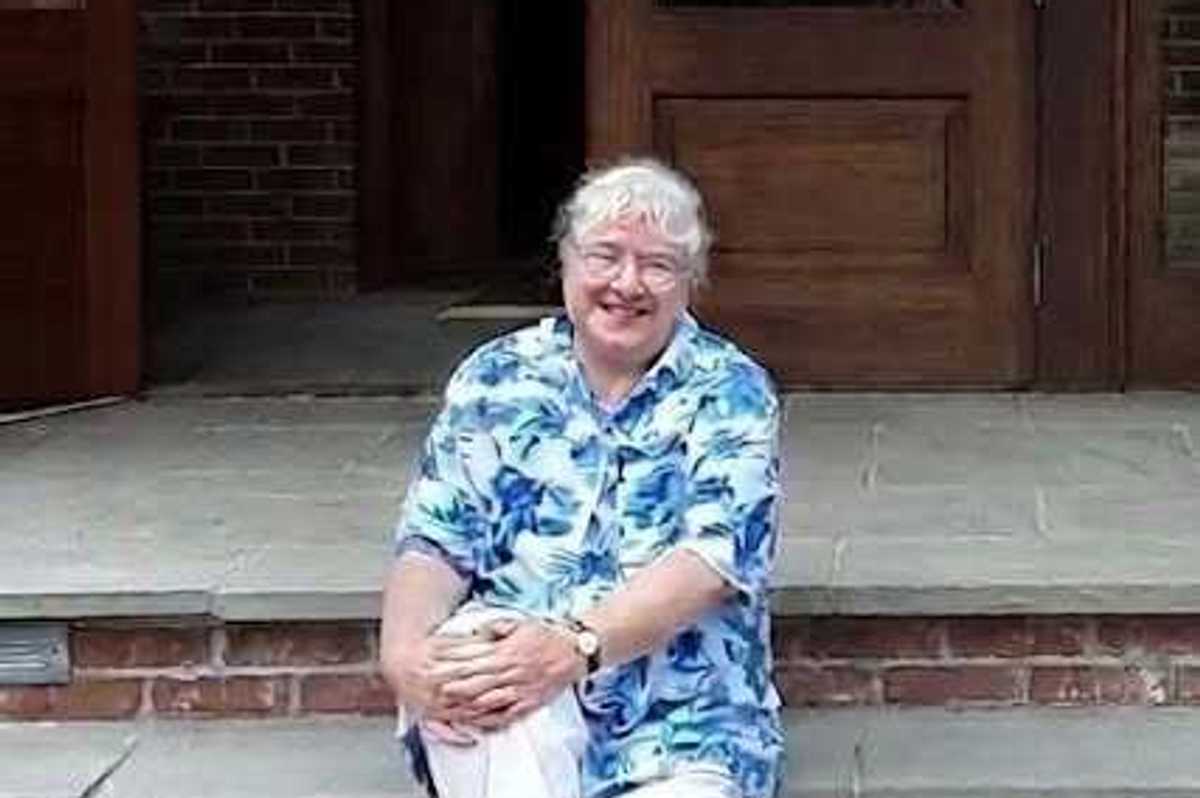
Dona Lee Alexander
Lakeville Journal
Jul 21, 2026
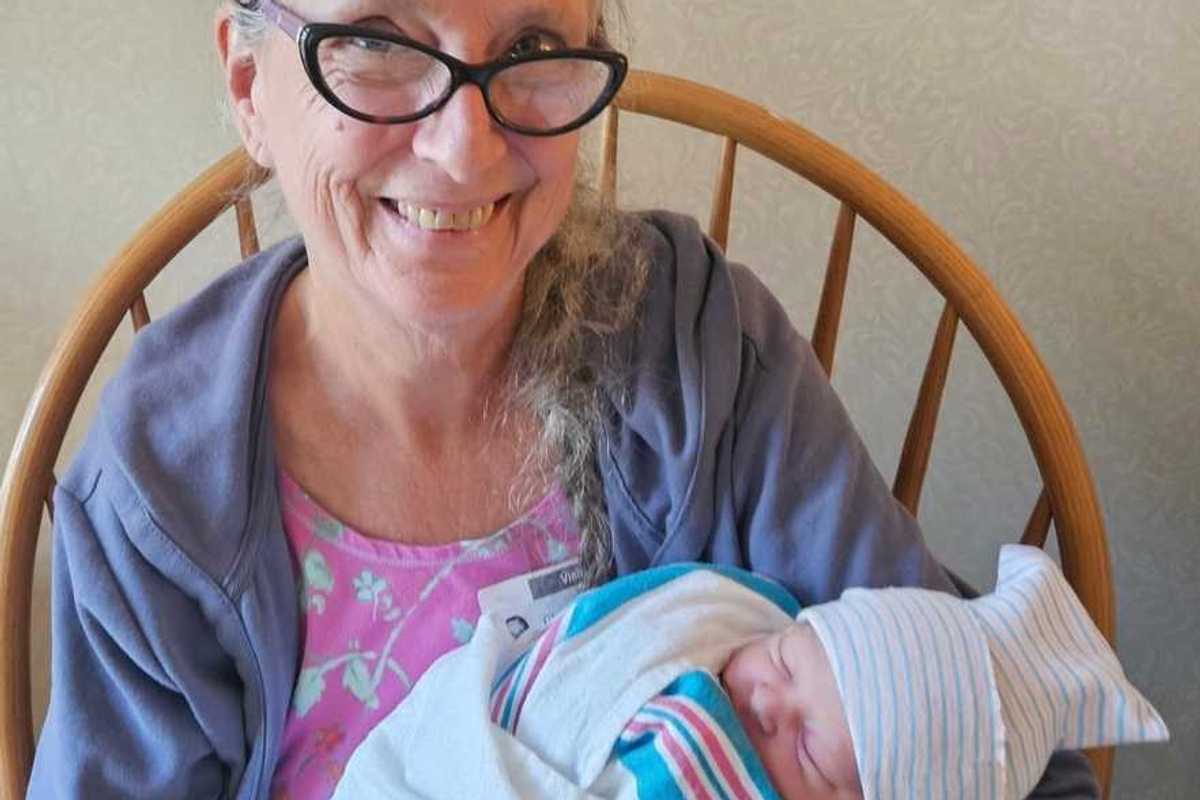
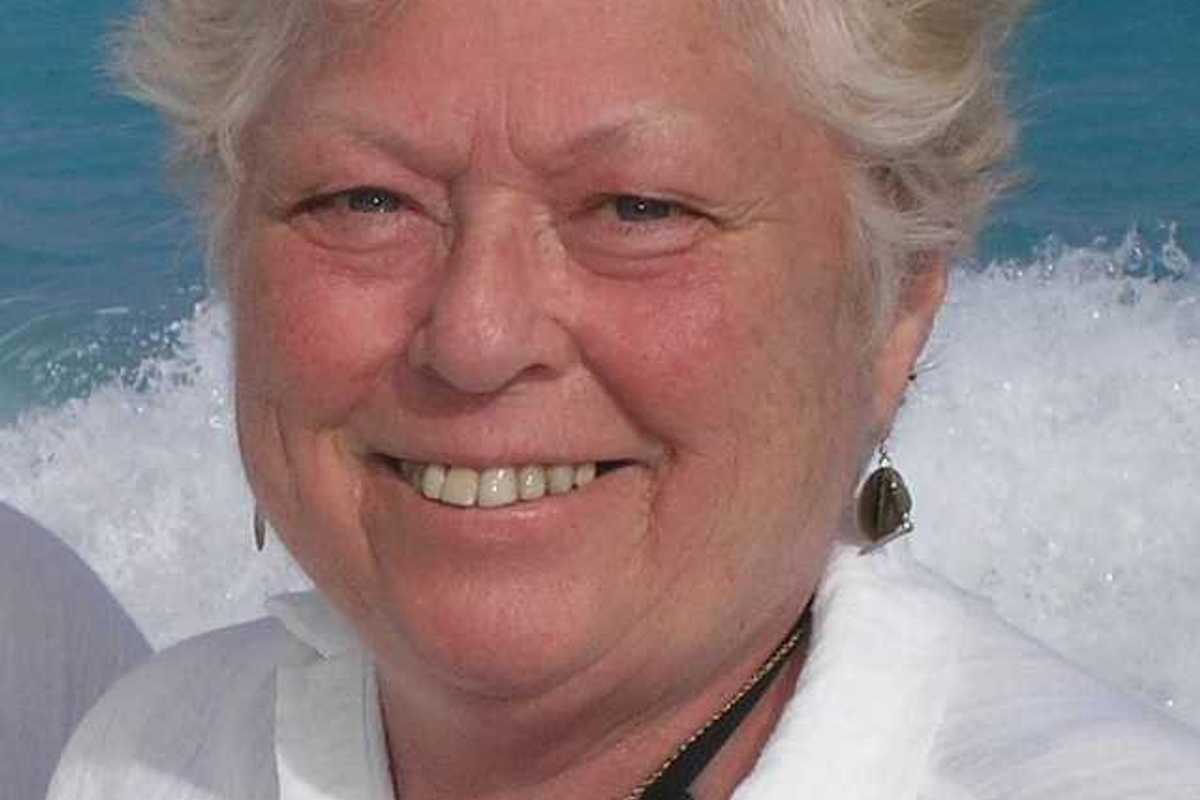
SALISBURY — It is with heavy hearts that we announce the passing of Dona Lee (Chilcoat) Alexander, our beloved mother, grandmother, daughter, sister, and friend, on July 9, 2026.
Born on Dec. 20, 1955, in Sharon, Connecticut, Dona lived a life filled with love, kindness, and an unwavering dedication to helping others.
Dona was preceded in death by her father, William Chilcoat, but leaves behind her loving mother, Katherine Chilcoat. Her cherished family includes her daughter, Sarah Olinger Hadoulis and son-in-law, Michael; her granddaughter, Penelope Hadoulis; her sister, Susan Chilcoat Bucceri and brother-in-law, Louis; her brother, Richard Chilcoat and sister-in-law, Stacey; nieces Katherine and Elizabeth Bucceri; and nephews Will, Ben (Lauren), and Graham Chilcoat.
Dona grew up in Lakeville where she graduated from Salisbury Central School (1969), Housatonic Valley Regional High School (1973), and Gettysburg College (1977) where she earned a degree in English Literature. Her thirst for knowledge and service continued as she became certified in Grief Counseling and Thanatology, completed her Clinical Pastoral Education, received her Florida Certification for Volunteer Management, and was ordained as an Inter-Faith Minister.
Dona’s professional life was a testament to her commitment to service. After she and her daughter Sarah returned to Salisbury in 1988, she worked as store manager of Community Lumber & Hardware (now Herringtons) and as a tea blender and sales manager for Harney & Sons Fine Tea before beginning a career that was dedicated to helping others. Her roles included Director of Therapeutic Recreation, Volunteers and Pastoral Services at Noble Horizons; office administrator for Habitat for Humanity NW CT; Director of Programs at Harvest Food and Outreach in Vero Beach, Florida; and as an in-home senior care aid for Senior Helpers of the Palm Beaches in Florida.
Some people leave behind footprints. Others leave behind a way of seeing the world. Dona was one of those people. She found beauty in the smallest things, especially a quiet walk on the beach with her eyes searching for sea glass, always believing that what the waves returned had a story to tell. She followed her heart wherever it led, never worried about fitting into any else’s idea of how life should be lived. She will be remembered for her gentle spirit, her dedication to helping others, her love for her new granddaughter, and her unwavering commitment to making the world a better place. She believed that acting on our better instincts reminds us, above everything, that we are all humans and that when we act with care and compassion, we can shape a more loving world. She was beautifully unconventional, deeply spiritual, and completely herself. There will never be another quite like her. We hope that wherever she is now, the shore is endless, the sea glass is abundant, and her spirit is as free as ever. She will be deeply missed.
Dona’s family wishes to extend their heartfelt gratitude to the Salisbury Visiting Nurse Association, particularly Cyndi, Laurie, and Molly, and to Visiting Nurse & Hospice of Litchfield County for their compassionate care and support.
In memory of Dona, the family suggests donations be made to the Little Guild in Cornwall, CT or Salisbury Family Services.
A celebration of her life will be held in the fall.
All other services will be private.
The Kenny Funeral Home has care of arrangements.
Keep ReadingShow less
Louise R. Black
Lakeville Journal
Jul 21, 2026
MILLERTON — Louise R. Black, 86, born July 16, 1939, in Queens, New York, died on July 15, 2026, with her partner of 26 years, Mary Howard, by her side. She is also survived by her nephews David Black and Jason Black, and his wife, Kerri; and niece Tiffany Black and her husband, Shlomo Toledano.
After graduating from the University of North Carolina Women’s College and earning two master’s degrees, Louise taught physical education for 35 years at Scarsdale (NY) High School, chairing the department and serving as the first woman Athletic Director. An accomplished fencer, tennis player, and swimmer, Louise’s enduring fondness for sports included a love of the Brooklyn Dodgers, though she never quite recovered from their move to the West Coast.
Louise’s artistic talents came through in her knitting, her painting, and her gardens. A master knitter, for many years she and Mary hosted a weekly knitting group at their home. She was recognized for her Japanese watercolors and landscapes; her passion for flowers was expressed in the abundant roses bordering her property.
An avid traveler, she also found great joy spending summers at her family camp on an island in the Hudson River. Cars and jazz were perennial fascinations, and Doris Day was a favorite.
Louise dedicated much of her life to community service, first as an enthusiastic volunteer at Habitat for Humanity in Westchester County. Following retirement, she moved to Millerton, New York, and was soon immersed in the local library, developing a finders’ guide for the North East Historical Society; and the co-founding of Comida de Vida food pantry at St. Thomas EpiscopalChurch in Amenia, New York.
In lieu of flowers, please consider donating to Food of Life / Comida de Vida Food Pantry St. Thomas Episcopal Church, 40 Leedsville Road, Amenia, NY 12501 (845) 373-9161 www.stthomasamenia.com or Habitat for Humanity: https://www.habitat.org/support
A celebration of Louise’s life will take place on BlackThursday, July 30, 2026 from 2pm to 4pm at the Scott D. Conklin Funeral Home, 37 Park Avenue, Millerton, NY 12546. To send an online condolence to the family, please visit www.conklinfuneralhome.com
Keep ReadingShow less
Jane Lindsay
Lakeville Journal
Jul 21, 2026
NORTH CANAAN — Jane Lindsay passed away suddenly on July 11, 2026, at Danbury Hospital. She was the longtime partner of Dennis Smalley.
Jane was born on Jan. 14, 1953, the daughter of Sally Hart and the late Raymond Hart.
She retired last year from Geer Village, where she entertained residents with her songs, poems, and wit, and, when not working, spread her music around town whenever she could.
Janey’s creativity was woven into every part of her life, from her love of music to her unmistakable artistic talent. Her unique style was recognizable, and each piece she created had a way of bringing a smile to those who experienced it—a reflection of the joy and imagination she shared so freely.
Jane is survived by her mother, Sally Hart; her sister, Diana Hart; her nieces, Allison Latulipe and Riley Hart; and several aunts, uncles, and cousins. She is predeceased by her brother, Jonathan Hart.
A memorial service will be held on Saturday, Aug. 1, at 2:00 p.m. at the North Cornwall Church. A reception will follow at the Parish House, 8 Bolton Hill Rd., Cornwall Village.
Memorial donations may be made to any animal shelter of your choosing.
In honor of Janey’s vibrant spirit, the family kindly asks that guests leave the dress clothes at home and instead wear tie-dye, something with cats on it, or a fun hat or headband—anything that celebrates the joy and individuality she brought to the world. Informality is a plus!
The Kenny Funeral Home has care of arrangements.
Keep ReadingShow less

Want more of our stories on Google? Click here to make us a Preferred Source.
Paul Chester Rooney Jr.
Lakeville Journal
Jul 21, 2026
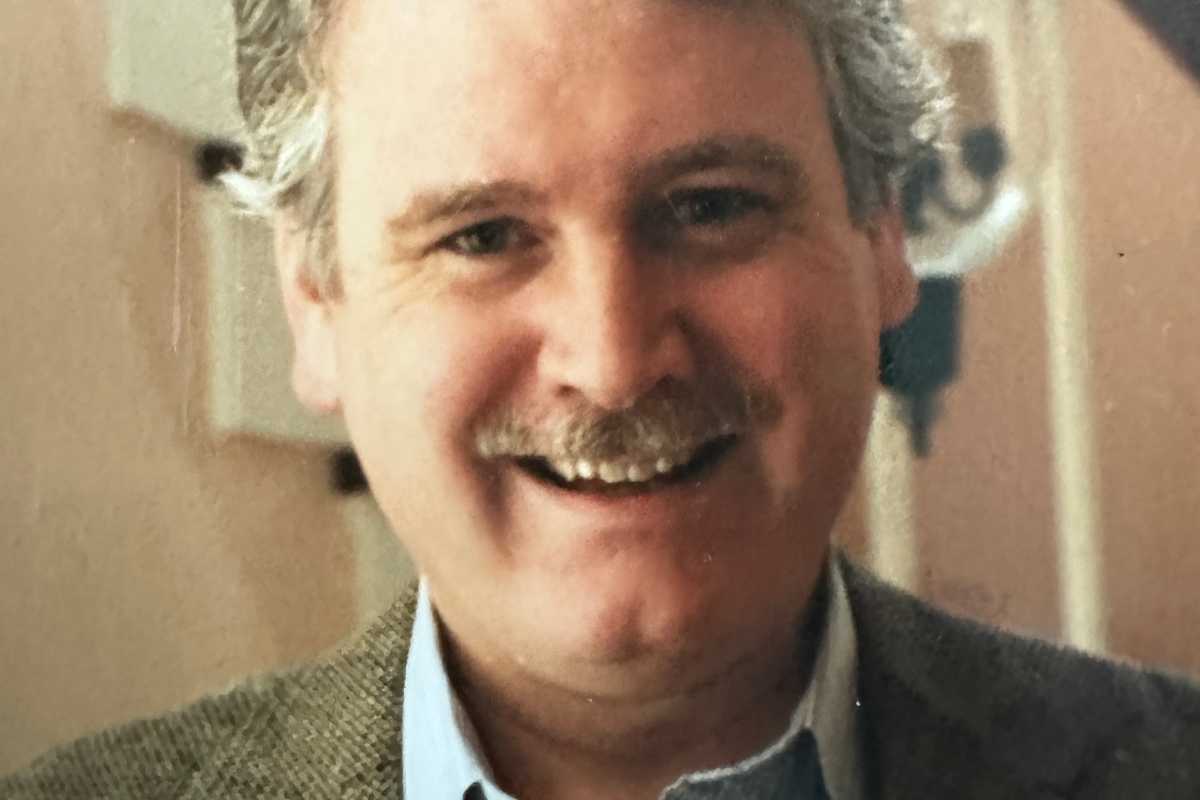
SHARON — Paul Chester Rooney Jr. of Ft. Lauderdale, Florida and Sharon, Connecticut died peacefully in Ft. Lauderdale on June 13 with family by his side. Born to Mary Katherine Brennan and Paul Rooney on Oct. 23, 1943, in Evanston, Illinois, he grew up in the US and London.
Paul graduated from The Oratory School, Reading, England, and Harvard College and Law School. After four years in the Navy, he was honorably discharged as full lieutenant in 1973. He built a 25-year career at global law firm White and Case in Manhattan, becoming a partner and corporate tax department head; he was known internationally for his legal acumen and creativity. He led an active social life in Manhattan, making life-long friends who enjoyed his sharp wit and repartee. Out of the office, he enjoyed playing squash at the Union League and University Clubs, and the city’s cultural offerings. A true patriot, Paul was honored to serve, until his death, on the Advisory Board of the Atlantic Legal Foundation, whose advocacy for individual liberty, free enterprise, property rights, sound science, and effective education aligned with his values. Upon retiring in 1998, the firm’s managing partner described his essence: “Spending time with Paul is like an Outward Bound adventure--physically and mentally demanding, and ultimately very gratifying.”
Paul eventually moved to his weekend Sharon home. He savored its small-town values, the opportunity to make friends from all walks of life and participate in local organizations. A perpetual student, he developed new interests, including gardening, reading all he could find about plants and trees, memorizing their Botanical Latin names, and hunting for specimens. After much studying and practicing, he became an avid bridge player and amateur chef. An outdoorsman, he played tennis at the Sharon Country Club; shot at nearby Mashomack Preserve; and skied and fly fished locally. He developed and owned golf courses in New York and Maryland in partnership with a friend. He devoured modern books on Greek and Roman history and re-read classics in ancient Latin and Greek. He also learned modern foreign languages and listened to classical music, discovering the varied interpretations and arrangements of different musicians and composers. In 2014 Paul became a Florida resident, spending over half the year there.
He is survived by his wife of 46 years, Maria Elena; daughter, Isabel Rooney; brother Peter Rooney; sisters, Margaret Rooney and Briahna Kelly; and sister-in-law Isabel La Vaute and her children and grandchildren. He will be remembered as a kindhearted optimistic gentleman. A celebration of his life will be announced later.
Keep ReadingShow less
Bed Race returns to North Canaan Saturday night, still time to register
Madi Long
Jul 17, 2026
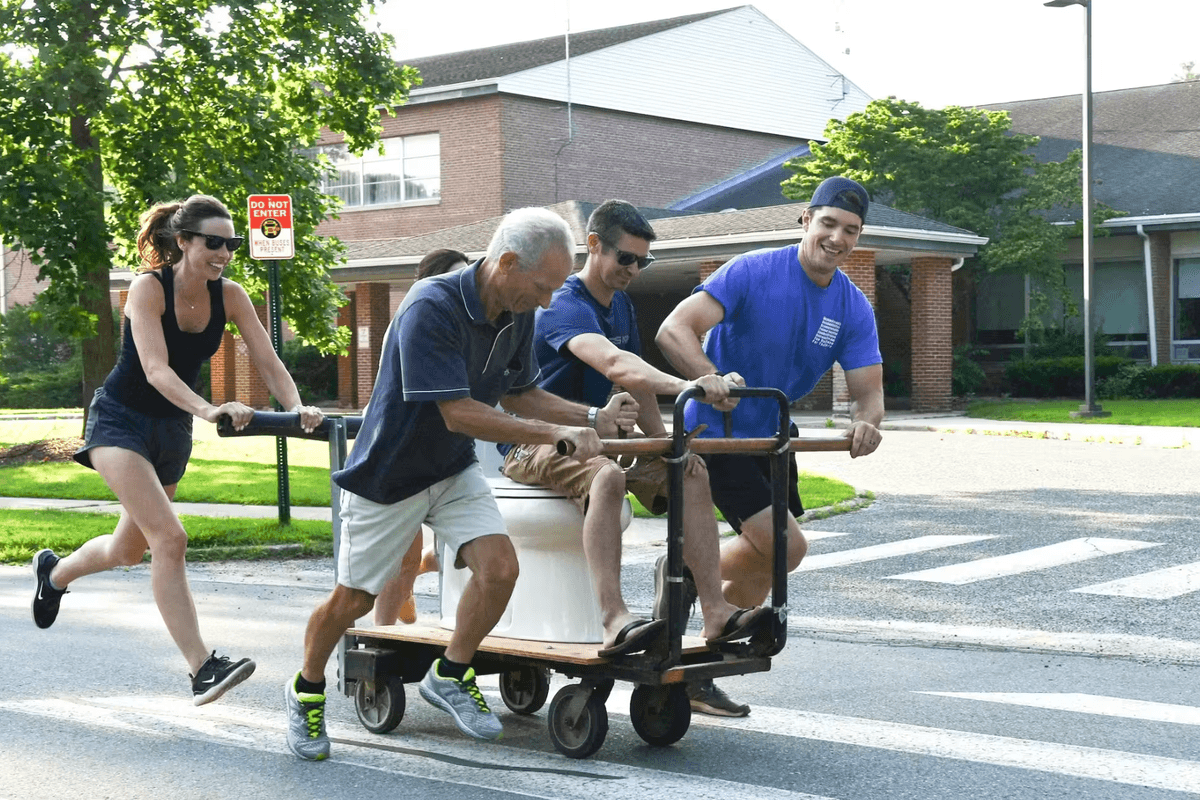
The Royal Flush won the bed race in 2025.
John Coston
NORTH CANAAN — The Annual Bed Race will return to Summer Nights of Canaan on Saturday July 18, following the Fireman’s Parade at 6 p.m.
Now a Summer Nights tradition, and before that, a staple of Railroad days since the early 1990s — the Bed Race is back after being revived in recent years by Will and Samantha Perotti. After the event lay dormant for several years, the couple volunteered to take it over and have been working to grow participation.
The lighthearted competition invites teams of five, with four people pushing and one riding atop the “bed.” The term is used loosely as any creative contraption with four wheels qualifies. Past entries have included a toilet bolted to a cart, a trash can on wheels, and a kayak mounted on wheels.
Participants must be 18 years or older to compete.
Teams race one at a time and will be timed pushing their “bed” down the street, around a cone, and back. Participants must be 18 years old.
The race was previously held at North Canaan Elementary School, but will be held on Main Street and will start by the St. Martin of Tours Church of St. Joseph.
“The road will be closed,” said Will Perotti. “There will be a ton of people right there, so it will be a spectacle.”
Will Perotti is encouraging people to just show up if they're interested in competing. Preparedness is not a worry at the Bed Race. When asked about his team on Friday, Will said, “I don't really have our team locked down together. I usually wait till the last minute and then I guilt trip somebody.”
The race is for bragging rights.
“I believe there will be a very, very expensive, really high-end piece of plastic trophy and bragging rights for the next year. That's really what's valuable.”
To sign-up, fill out the form at tinyurl.com/bedrace2026.
Keep ReadingShow less
Grand jury indicts Cole Bushnell on murder, evidence tampering charges
Christian Murray
Jul 17, 2026
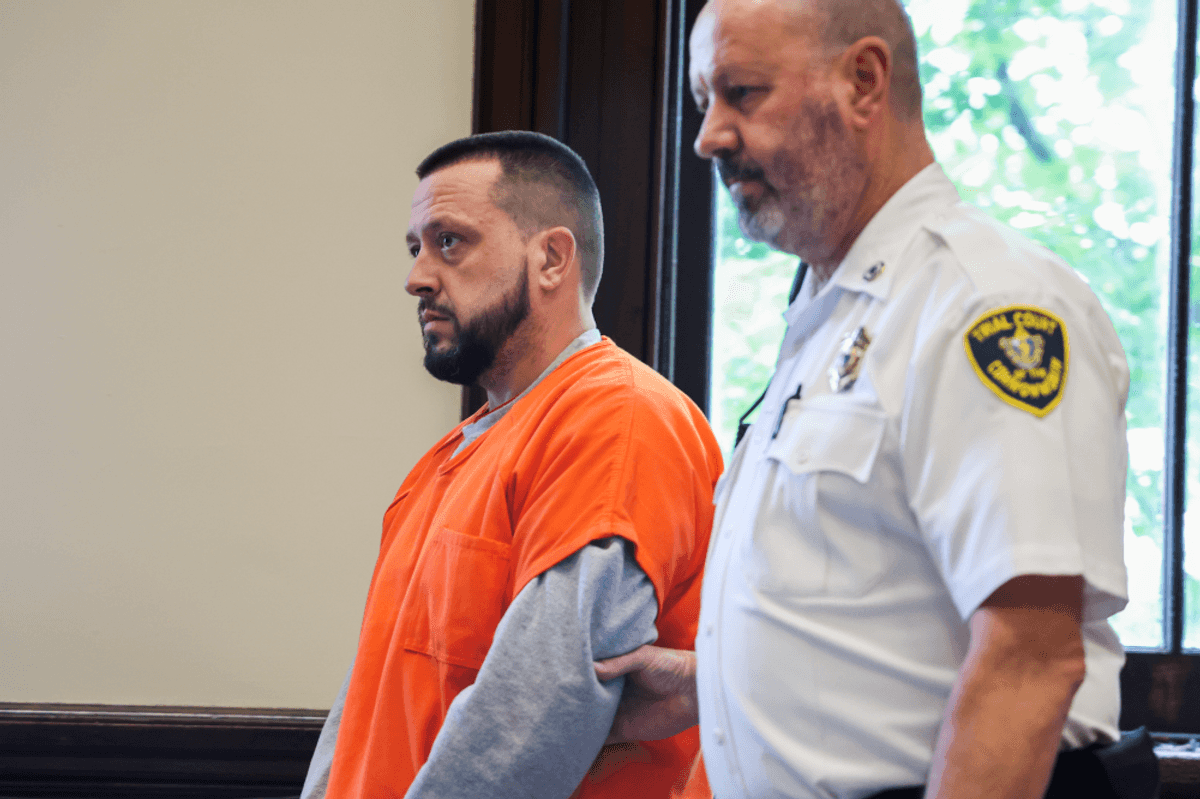
Cole Bushnell appears in Berkshire Superior Court on Thursday after a grand jury indicted him on charges of murder and evidence tampering.
Madi Long
An Ashley Falls man whose arrest drew attention on both sides of the Massachusetts-Connecticut border has been indicted on charges of murder and evidence tampering in connection with the June 1 killing of Michael A. Moore, a former Falls Village resident.
A Berkshire County grand jury has indicted Cole Bushnell, 41, on charges of murder and evidence tampering in the death of Moore, 40, of Winsted. The evidence tampering count is a new felony charge, with prosecutors alleging that Bushnell attempted to destroy his cellphone following the killing to conceal evidence.
Bushnell, who owned a painting business, was indicted Thursday morning in Berkshire Superior Court, where he entered the courtroom in handcuffs. He showed little visible emotion, kept his eyes on the floor throughout the brief hearing and remained silent. The courtroom was largely empty.
According to a spokesperson for the Berkshire District Attorney's Office, Bushnell pleaded not guilty to both charges.
The indictment alleges that on or about June 1, Bushnell assaulted and beat Moore "by means of a dangerous weapon, to wit: a knife and a sledgehammer," causing his death.
A second count charges Bushnell with evidence tampering. Prosecutors allege Bushnell attempted to impair evidence "in an official proceeding, by attempting to destroy his cellphone, either by his own actions or by directing another person to do so."
According to prosecutors, Moore, who also worked as a painting contractor, went to Bushnell's Ashley Falls property on June 1. Prosecutors allege the two argued over money before Bushnell killed Moore inside a greenhouse on the property.
Moore was killed after suffering blunt-force trauma to the head and lacerations to his back, according to prosecutors. His body was allegedly concealed beneath a mattress until one of Bushnell's workers discovered it after Bushnell led him into the greenhouse. The worker then alerted Connecticut State Police at the Troop B barracks in North Canaan.
Bushnell was ordered held without the right to bail pending further proceedings.
During the hearing, prosecutors also sought a no-contact order prohibiting Bushnell from communicating with witnesses in the case, arguing there had been efforts to contact at least one witness. Bushnell's court-appointed defense attorney, Jeffrey Brown, objected, arguing the court lacked authority to impose such a condition while Bushnell remained held without bail.
Brown, a private criminal defense attorney and partner at Brown & Brown, declined to comment on the case.
The case has gained widespread attention throughout the Northwest Corner because both men are well known in the region.
Bushnell, who attended North Canaan Elementary School, and Moore, who attended Lee H. Kellogg School in Falls Village, both attended Housatonic Valley Regional High School. The two became friends and remained close into adulthood, working together as painters on homes throughout the region before the alleged killing.
Keep ReadingShow less
Want more of our stories on Google? Click here to make us a Preferred Source.
loading